Are you even measuring the real Net Promoter Score?
It is rare for us to like a brand whole-heartedly or dislike intensely. Human purchasing decision making is a messy complicated process and our true intentions are better understood from the clues to our emotions than the simplistic and mechanical Net Promoter Score reducing everything to a single number of recommendatbility.
The Net Promoter Score created by Fred Reichheld is an easy way to find and measure customer loyalty. The NPS purports to measure if customers are really happy with your product or service by measuring recommendatbility, the underlying hypothesis being that we only recommend stuff to our friends and family when we are confident that will be socially rewarding to us in terms of esteem and prestige. Hence, conversely, if we are not completely sure of a product or service, our recommendatbility will be low.
This essentially boils down NPS to a single rating scale of 10. If you are in a regular business team, high chance is that you find NPS easy and “reliable” because you can use it anytime during the customer lifecycle. And you can use different ways to share it with the customer.
The NPS survey is typically answered in one way: the answer to the “how likely” question. This answer goes from 0 to 10. Where 0 is not likely, and 10 is most likely. Depending on the answer is how the customer is going to be classified. In the NPS survey, customers are classified as promoters, passive, and detractors.
Another massive advantage of the NPS surveys are that they tend to get higher response rate due to the lack of typing involved from customers. Grigore Railenau, Founder and CEO of Retently, states, “One last NPS advantage worth mentioning is that these surveys tend to get a higher response rate. While the average survey has a response rate of over 3 percent, NPS surveys regularly earn response rates in the 10 to 30% range.” Regular surveys tend to have more incisive questions that require typing long descriptions, reducing the customer’s desire to invest effort in them.
Challenges with this approach
1. Low Attention Error
The most obvious challenge of reducing human recommendatbility to a single number arbitrarily tapped by the customers on their phone is that it can be highly error prone due to the low attention given to it. Other than accidental input, this single number does not measure seasonality, mood shift and a host of other behaviours that impact recommendatbility. And yet, companies make complete full year plans based on the point-in-time snapshot of NPS.
2. We have Contradictory Emotions
In May 2018, the customer experience agency C-Space launched a study regarding NPS and discovered that the classification of the customers in the NPS does not accommodate for complex modern purchasing journeys. According to their experts, the classification used in the NPS is arbitrary and eliminates potential information for companies.
Christina Stahlkopf, associate director of research and analytics in C-Space, points out that “NPS presumes that someone can’t be both a promoter and a detractor. But humans are complex and often contradictory. Our minds are always operating on multiple planes—placing facts, feelings, and experiences within contextual and subjective frameworks.” This doesn’t seem right because the human mind is tricky, complex, and sometimes contradictory
As an example imagine you are buying two objects – a vacuum cleaner and a shoe from an online marketplace. The cleaner is perfect as per its specification but the shoe is one size too small. You are upset about the shoe but satisfied with the vacuum cleaner. What will be your NPS for the marketplace? How will companies extract this nuance from the NPS that their shoe listing is inaccurate vs. the cleaner listing and subsequently take action for improving shoe selling process while doubling down on the cleaner selling strategy?
3. The Detractor Bias
Another big problem of the NPS and customer experience experts who use is that it heavily leans towards the detractors. The detractors are usually the most vocal community amongst any user group and often companies obsess over them trading off strategies intended to help the supportive but silent majority. Furthermore the C-Space study realized that there is not a strong correlation between detraction and recommendations as the drivers can be different. As an example say you are moderately happy with a hotel after a business travel. However you still recommend it to your colleagues as it is in a safe neighbourhood next to the office building. Hence safety precedes ambiance as a driver.
Non-linear Decision Making
Human decision making is ultimately messy without complete linear coherence or correlation. In this landmark Think with Google paper, their researchers found that ultimately purchasing decisions happen in the messy middle of contradictory emotions.
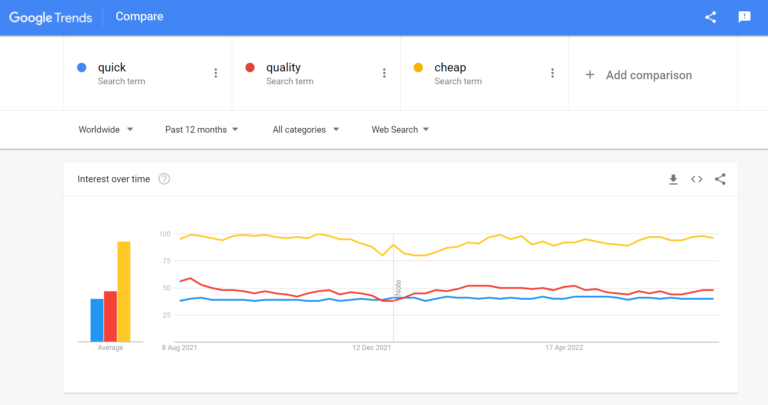
For example in this Google Trend Image, you see customers clearly wanting their product cheap but they also want them quickly and of high quality creating a duality for manufacturers. It is important to identify which driver is linked to which customer to understand how much they value that driver. If they become detractor to their valued driver, that may reduce recommendability or increase churn, not in other drivers.
Understanding this non-linear nuance of customer expectations for different key drivers, is extremely important for interpreting NPS clearly.
Google Trends: We are caught in the contradictory expectations of Quick vs. Quality vs. Cheap
How to avoid the classification error?
1. Identify Problem Drivers
NPS is an outcome. Your team needs to focus on the problem drivers that lead to the outcome. Once the input drivers are identified – via better questions or easier input mechanism like Voice, the team can focus on eliminating those drivers and gaining much better customer satisfaction in various dimensions than one simplistic easy score that masks underlying issues.
2. Relative Promoters and Detractors per Driver
In the traditional formulaic NPS score, you tend to subtract the detractors from promoters to arrive at a net score at a point of time. However this one-dimensional formula fails to accommodate the duality in people or correct for their mood at that point of time.
Hence we recommend to measure input drivers over a period of time and discover relative promoters and drivers for that context. This contextualization will eliminate the one score bias, masking of a poor drivers by one strong driver and generally be more representative of the actual behaviours of the customers and their key pain points vs. a catch-all score.
How to get a better NPS Survey?
At Softbrik, we have thought about improving the NPS long and hard and have created a whole new mechanism for measuring it.
1. Voice & Image Based
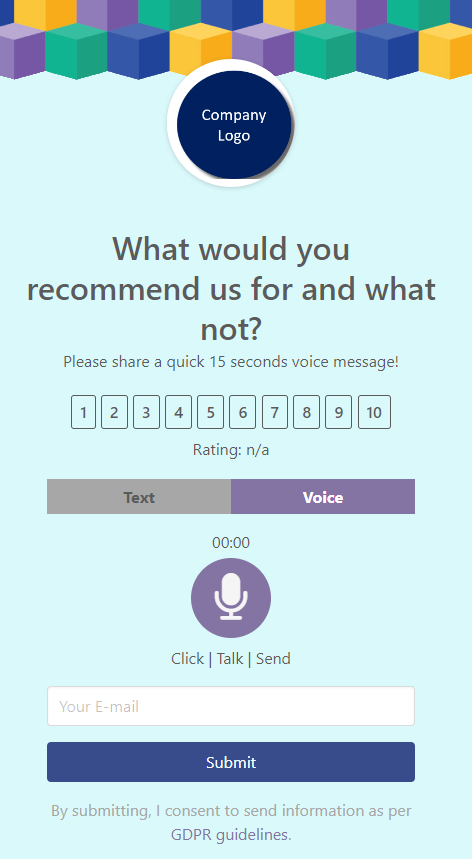
The primary problem that companies face is that customers do not want to type long sentences and give input. Hence we have replaced text based explanation with multiple voice messages for customers to quickly talk in 10 seconds vs. typing the same over 2 minutes. You can also put images for people to tap and identify contexts instead of typing (called Image Association).
2. Open-Ended Categorization
While we still collect the 10 point NPS score, we nuance that with the customer feedback and categorizing the feedback with our AI algorithm. Depending on what people say the Promoter and Detractor contexts are identified and it nuances the ratings with broader categorization.
3. Avoid Vanity Metrics
Just like surveys, NPS can become a vanity metrics of recommendatbility. Hence it is important to check them but not make them the north star of all Customer Acquisition and Retention strategies including rewarding your organization as that incentivizes filling up scorecards over solving true problem drivers.
4. Focus on Qualitative Data
Human beings are far more consistent when describing a scene with adjectives than ratings. Hence collect detailed feedback with adjectives and then try to extract sense out of them manually or with the help of AI/ML.
5. 10 Second design
Good NPS surveys are short and fit within 1 screen and 2 scrolls of a standard iPhone or Android Phone taking at the maximum 30 seconds. Low barrier to give feedback increases response rate by 250 – 300%. However having the voice and/or image element increases attention and reduces low attention errors like wrong tapping.
How to improve your NPS Collection?
In Softbrik, we use the power of browser based Voice-to-Text to help teams create truly open ended NPS surveys.
Your team can design NPS voice feedback forms that are shared with your customers throughout their life journey like pre-sales, usage feedback, support and re-purchase. The forms are shared as either QR Codes or Web-links on websites and email. Customers just click or scan and talk in 22 languages. As talking is easier than typing we increase response rates by up to 500% and in 10 seconds capture 5 times more information than written text.
Our Machine Learning transcribes the voice to text, identifying critical Problem Drivers much deeper than just ratings from open ended customer responses. Additionally it translates the feedback to the team’s common language, accommodates for minor variations in accents, tones and phrasing by languages.
The feedback are finally grouped by tags with emotional analysis for either quick bulk response or deeper structural solutions. This layers the NPS rating score with nuances of customer expectations and behaviours than just following the single point score blindly.